BAJAJ-FINSERV-MULTI-CAP-FUND-REGULAR-GROWTH
Fund Manager : FM 1 - Mr. Nimesh Chandan (Equity Portion) , FM 2 - Mr. Sorbh Gupta (Equity Portion) , FM-3- Mr. Siddharth Chaudhary (Debt Portion) | Benchmark : NIFTY500 MULTICAP 50:25:25 TRI | Category : Equity: Multi Cap

10.924 0.06 (0.51 %)

NAV as on 13-08-2025

84.04 Cr

AUM as on 31-07-2025

Rtn ( Since Inception )

9.04%

Inception Date

Feb 27, 2025

Expense Ratio

2.24%

Fund Status

Open Ended Scheme

Min. Investment (Rs)

500

Min. Topup (Rs)

100

Min. SIP Amount (Rs)

500

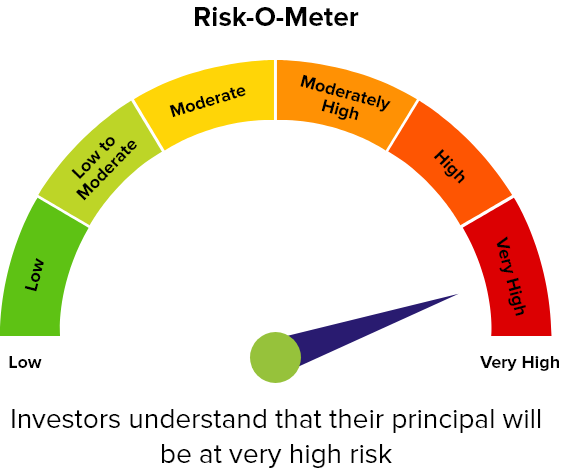
Risk Status

very high

Investment Objective : The objective of the Scheme is to generate long term capital appreciation by investing in equity and equity related securities of large cap, mid cap and small cap companies. However, there is no assurance that the investment objective of the Scheme will be achieved.

Returns (%)
1 Mon (%) 3 Mon (%) 6 Mon (%) 1 Yr (%) 3 Yrs (%) 5 Yrs (%) 10 Yrs (%)
Fund -4.83 0.82 0.0 0.0 0.0 0.0 0.0
Benchmark - NIFTY500 MULTICAP 50:25:25 TRI -2.82 3.08 10.21 0.61 18.28 23.95 14.9
Category - Equity: Multi Cap -2.12 3.6 9.9 1.3 18.91 23.62 14.4
Rank within Category 31 29
Number of Funds within Category 31 30

Returns less than 1 year are in absolute and Returns greater than 1 year period are compounded annualised (CAGR)

Equity Holdings (Top 10)
CompanyHoldings (%)
HDFC BANK LIMITED EQ NEW FV RE. 1/-5.2
ASIAN PAINTS LIMITED EQ NEW FV Re. 1/-3.12
RELIANCE INDUSTRIES LIMITED EQ3.1
KOTAK MAHINDRA BANK LIMITED EQ NEW F.V RS.5/-2.91
BAJAJ FINSERV LIMITED EQ NEW FV RE.1/-2.63
LTIMINDTREE LIMITED EQ2.49
SHREE CEMENT LIMITED EQ2.46
Net Receivables / (Payables)2.01
BAYER CROPSCIENCE LIMITED EQ FV RS. 10/-1.96
BHARAT HEAVY ELECTRICALS LIMITED EQ NEW FV RS. 2/-1.93
CITY UNION BANK LIMITED EQ NEW RS. 1/-1.85
ADITYA BIRLA CAPITAL LIMITED EQ1.79
BIOCON LIMITED EQ1.74
BRITANNIA INDUSTRIES LIMITED EQ NEW FV RS 11.69
Canara Bank1.67
DALMIA BHARAT LIMITED EQ NEW FV RS 21.66
SBI LIFE INSURANCE COMPANY LIMITED EQ1.58
HINDUSTAN UNILEVER LIMITED EQ F.V. RS 11.54
ADITYA BIRLA SUN LIFE AMC LIMITED EQ NEW FV Rs.5/-1.53
CRISIL LIMITED EQ NEW FV Re. 1/-1.53
MARICO LIMITED NEW EQ RE.11.51
PRESTIGE ESTATES PROJECTS LIMITED EQ1.46
TATA STEEL LIMITED EQ NEW FV RE.1/-1.46
KAJARIA CERAMICS LIMITED EQ NEW FV RE. 1/-1.44
MAHANAGAR GAS LIMITED EQ1.4
ICICI BANK LIMITED EQ NEW FV RS. 2/-1.31
ZYDUS WELLNESS LIMITED EQ1.3
UJJIVAN SMALL FINANCE BANK LIMITED EQ1.25
UNITED SPIRITS LIMITED EQ NEW FV RS. 2/-1.19
INDUS TOWERS LIMITED EQ1.16
INFOSYS LIMITED EQ FV RS 51.15
CAMLIN FINE SCIENCES LIMITED EQ NEW FV RE.1/-1.13
CREDITACCESS GRAMEEN LIMITED EQ1.11
ITC Hotels Ltd.1.04
ASTRAL LIMITED EQ NEW FV RE. 1/-1.04
JK LAKSHMI CEMENT LIMITED EQ NEW RS.5/-1.02
DR. LAL PATHLABS LIMITED EQ NEW FV RS. 10/-1
GLAXOSMITHKLINE PHARMACEUTICALS LTD EQ0.97
YES BANK LIMITED EQ NEW FV RS. 2/-0.96
HINDALCO INDUSTRIES LIMITED EQ NEW FV RE. 1/-0.96
PFIZER LIMITED EQ0.96
SRF LIMITED EQ0.96
VINATI ORGANICS LIMITED EQ NEW FV RE.1/-0.96
RHI MAGNESITA INDIA LIMITED EQ0.94
K.P.R. MILL LIMITED EQ NEW FV Re. 1/-0.92
STEEL AUTHORITY OF INDIA LIMITED EQ0.89
TECH MAHINDRA LIMITED EQ NEW FV RS. 5/-0.87
ADANI WILMAR LIMITED EQ NEW FV Re.1/-0.86
WHIRLPOOL OF INDIA LIMITED EQ0.86
CENTRAL BANK OF INDIA EQ0.85
CERA SANITARYWARE LIMITED EQ0.85
CAN FIN HOMES LIMITED EQ NEW FV RS. 2/-0.84
HEG Limited0.83
MARUTI SUZUKI INDIA LIMITED EQ0.83
HONEYWELL AUTOMATION INDIA LIMITED EQ0.82
BAJAJ AUTO LIMITED EQ0.81
WESTLIFE DEVELOPMENT LIMITED EQ NEW FV RS. 2/-0.8
CENTURY PLYBOARDS INDIA LIMITED EQ NEW RS.1/-0.77
AXIS BANK LIMITED EQ NE FV RS. 2/-0.77
PIRAMAL ENTERPRISES LIMITED EQ NEW FV RS. 2/-0.76
STERLITE TECHNOLOGIES LIMITED EQ NEW F.V. RS.2/-0.72
V.I.P INDUSTRIES LIMITED EQ NEW FV RS. 2/-0.71
Nestle India Ltd0.7
ALEMBIC PHARMACEUTICALS LIMITED EQ0.68
NAVIN FLUORINE INTERNATIONAL LTD EQ NEW FV RS. 2/-0.66
LIC HOUSING FINANCE LIMITED EQ NEW F.V. RS.2/-0.66
Clearing Corporation of India Ltd0.65
BALKRISHNA INDUSTRIES LIMITED EQ NEW F.V RS.2/-0.63
APOLLO HOSPITALS ENTERPRISE LIMITED EQ NEW F.V. RS.5/-0.62
ATUL LIMITED EQ0.62
GARWARE TECHNICAL FIBRES LIMITED EQ0.6
HAVELLS INDIA LIMITED EQ NEW FV RE. 1/-0.59
MOTHERSON SUMI WIRING INDIA LIMITED EQ0.59
LA OPALA RG LIMITED EQ NEW FV RS. 2/-0.57
RESTAURANT BRANDS ASIA LIMITED EQ0.54
KIRLOSKAR OIL ENGINES LIMITED EQ0.54
FSN E-COMMERCE VENTURES LIMITED EQ NEW FV RE.1/-0.49
ORIENT ELECTRIC LIMITED EQ0.44
ICRA LIMITED EQ0.44
GRINDWELL NORTON LIMITED EQ NEW FV RS.5/-0.41
SUNDRAM FASTENERS LIMITED EQ FV RS. 1/-0.4
IPCA LABORATORIES LIMITED EQ NEW FV RE .1/-0.3
BERGER PAINTS INDIA LIMITED EQ NEW FV RE. 1/-0.3
PAGE INDUSTRIES LIMITED EQ NEW FV RS.10/-0.29
PVR LIMITED EQ0.29
DEEPAK NITRITE LIMITED EQ NEW FV RS. 2/-0.24
HDFC ASSET MANAGEMENT COMPANY LTD EQ NEW FV RS. 5/-0.24
TEAM LEASE SERVICES LIMITED EQ NEW FV RS. 10/-0.23
MOLD-TEK PACKAGING LIMITED EQ NEW FV RS. 5/-0.21
GREENPANEL INDUSTRIES LIMITED EQ0.14
ICICI LOMBARD GEN INSURANCE CO LTD EQ0.1
Show All Holdings
Sector Allocation (%)
Financial ServicesConsumer DurablesFast Moving Consumer...Capital GoodsChemicalsHealthcareConstruction MaterialsInformation TechnologyOil, Gas & Consumable...Metals & Mining3535282821211414770029.98 %9.79 %8.79 %6.72 %6.53 %6.27 %5.14 %4.51 %4.5 %3.31 %
Asset Allocation
Asset Class Allocation (%)
Equity 97.34
Cash & Cash Equivalents 2.66


Portfolio Behavior
Mean 0.0
Sharpe Ratio 0.0
Alpha 0.0
Beta 0.0
Standard Deviation 0.0
Sortino 0.0
Portfolio Turnover
Market Cap Distribution
Large CapMid CapSmall CapOthers40403030202010100039.14 %25.61 %32.59 %2.66 %
Yearly Performance (%)
Created with Highstock 2.1.5ValuesBAJAJ FINSERV MULTI CAP FUND - REGULAR - GROWTHNIFTY500 MULTICAP 50:25:25 TRIEquity: Multi Cap2013201420152016201720182019202020212022-250255075
Standard Performance
Scheme
Bajaj Finserv Multi Cap Fund Reg Gr
Benchmark
NIFTY500 MULTICAP 50:25:25 TRI
Additional Benchmark
NIFTY 50 TRI
Category Average
Period Returns Value of
10000 invested
Returns Value of
10000 invested
Returns Value of
10000 invested
Returns Value of
10000 invested
1 Year 0.0 %10,0000.61 %10,0613.26103261.310130
3 Year 0.0 %10,00018.28 %16,54812.911439518.9116814
5 Year 0.0 %10,00023.95 %29,25818.272314123.6228870
10 Year 0.0 %10,00014.9 %40,10612.793332114.438394
Since inception 9.04 %7,07416.0 %5,52313.81596114.325855
Riskometer
riskometer
SIP Returns (Monthly SIP of Rs. 10,000)
3 Year 5 Year 10 Year 15 Year
Scheme Name Invested Amt Current Value XIRR (%) Invested Amt Current Value XIRR (%) Invested Amt Current Value XIRR (%) Invested Amt Current Value XIRR (%)
NIFTY500 MULTICAP 50:25:25 TRI 360,000 452,789 16.41 600,000 922,962 17.84 1,200,000 2,902,453 17.09 1,800,000 6,695,527 16.09
Equity: Multi Cap 360,000 456,542 16.91 600,000 929,988 18 1,200,000 2,915,704 17.09 1,800,000 6,984,296 16.52

Disclaimer : Mutualfundtools.com has gathered all the data, information, statistics from the sources believed to be highly reliable and true. All necessary precautions have been taken to avoid any error, lapse or insufficiency, however, no representations or warranties are made (express or implied) as to the reliability, accuracy or completeness of such information. mutualfundtools.com cannot be held liable for any loss arising directly or indirectly from the use of, or any action taken in on, any information appearing herein.

Returns less than 1 year are in absolute and greater than 1 year are compounded annualised (CAGR). SIP returns are shown in XIRR (%).

The Risk Level of any of the schemes must always be commensurate with the risk profile, investment objective or financial goals of the investor concerned. Mutual Fund Distributors (MFDs) or Registered Investment Advisors (RIAs) should take the risk profile and investment needs of individual investors into consideration and make scheme(s) or asset allocation recommendations accordingly.

Mutual Fund investments are subject to market risks, read all scheme related documents carefully. Past performance may or may not be sustained in the future. Investors should always invest according to their risk appetite and consult with their mutual fund distributors or financial advisor before investing.